10. In Situ Summarization with VTK-m
David Thompson, Sebastien Jourdain, Andrew Bauer, Berk Geveci, Robert Maynard, Ranga Raju Vatsavai, and Patrick O’Leary
10.1. Full Text
Link to the full text PDF.
10.1.1. Abstract
Summarization and compression at current and future scales requires a framework for developing and benchmarking algorithms. We present a framework created by integrating existing, production- ready projects and provide timings of two particular algorithms that serve as exemplars for summarization: a wavelet-based data reduction filter and a generator for creating image-like databases of extracted features (isocontours in this case). Both support browser-based, post-hoc, interactive visualization of the summary for decision- making. A study of their weak-scaling on a distributed multi-GPU system is included.
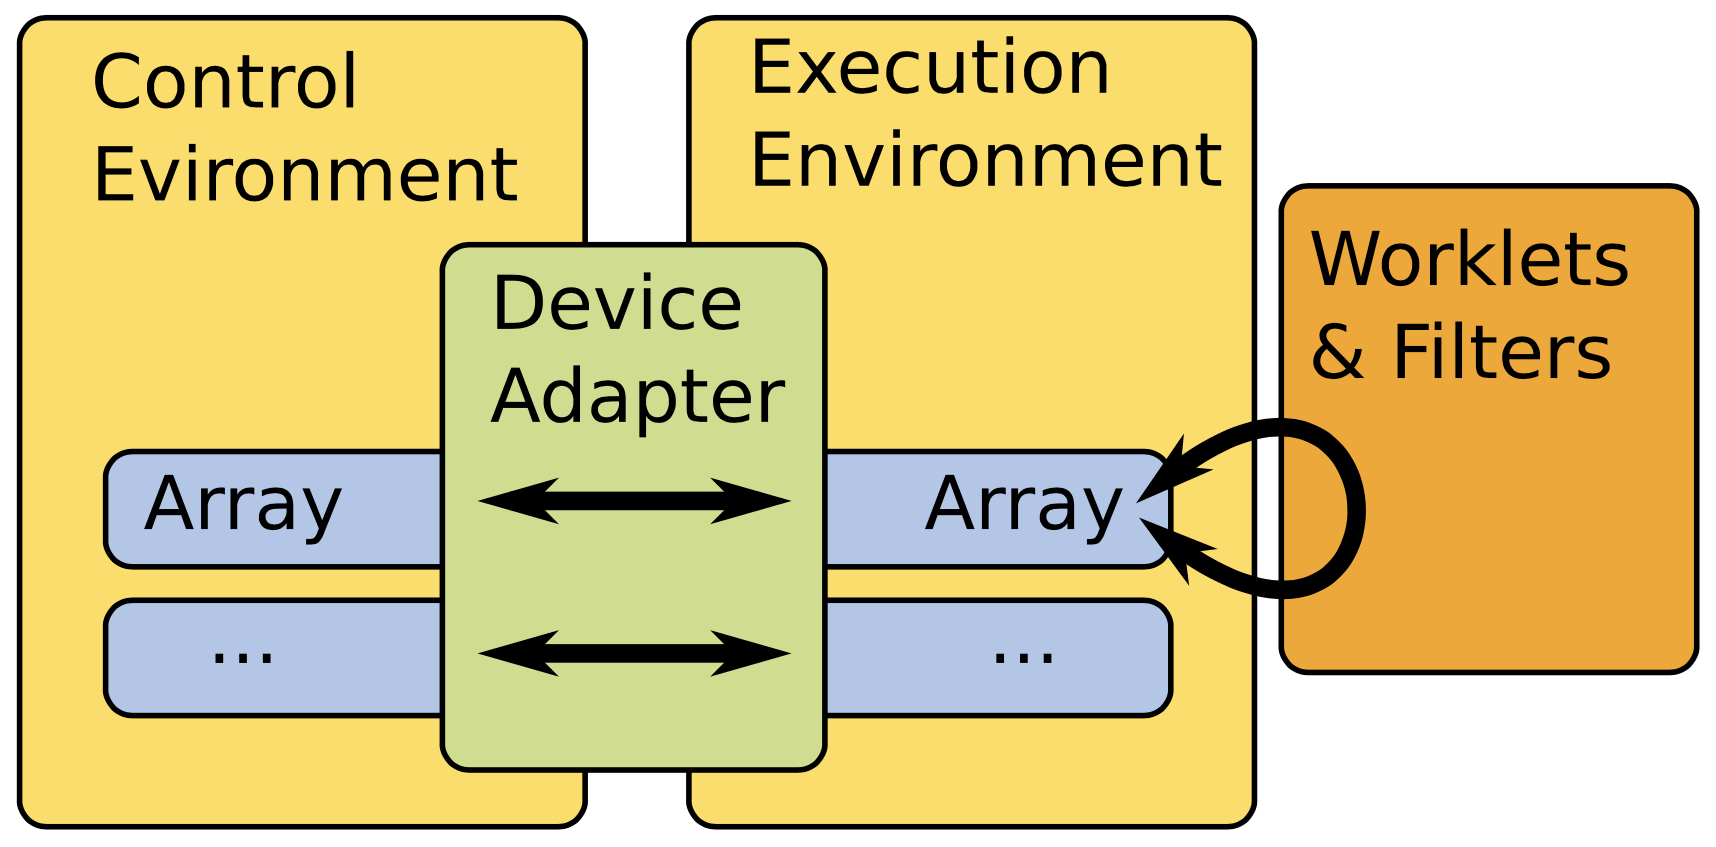
Fig. 10.1 VTKm’s architecture lazily transfers arrays to streaming processors for analysis.
10.1.2. Summarization Examples
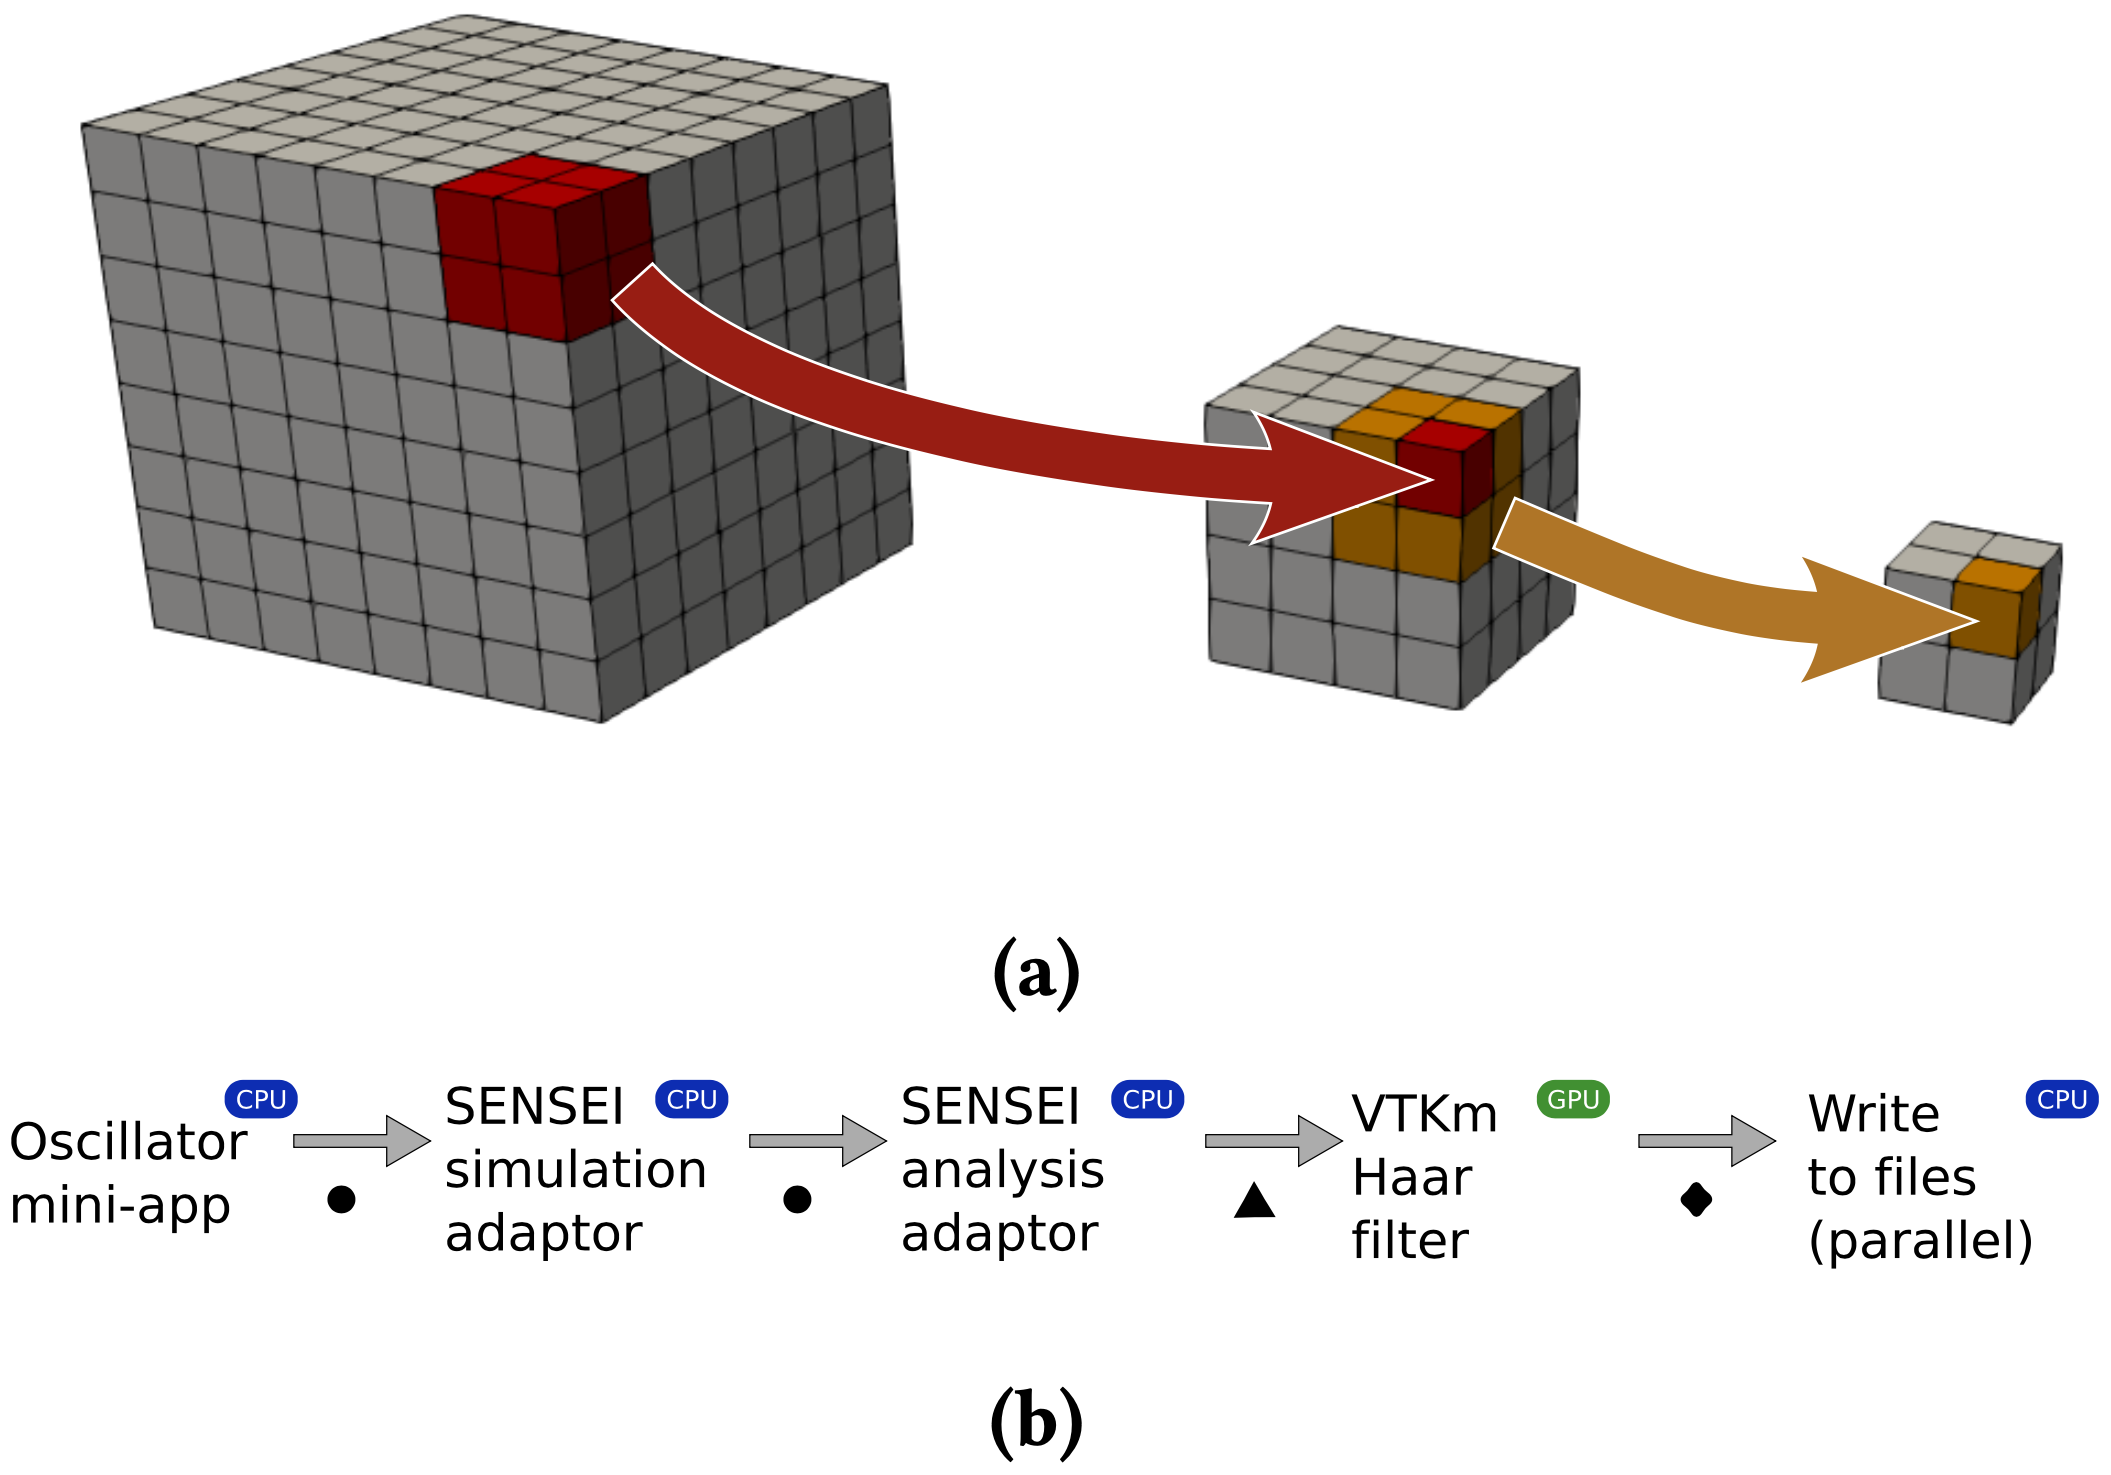
Fig. 10.2 Data Reduction - (a) By running a Haar wavelet filter multiple times, we can reduce the volume to a fixed size that is appropri- ate for rendering in a browser via ArcticViewer (depicted in Figure 5b). (b) Our wavelet-based reduction pipeline uses VTKm to compute multiple passes of the DHW transform. Circular dots indicate a zero-copy handoff of data. The tri- angle and diamond indicate where VTKm and VTK transfer data to/from the GPU, respectively.
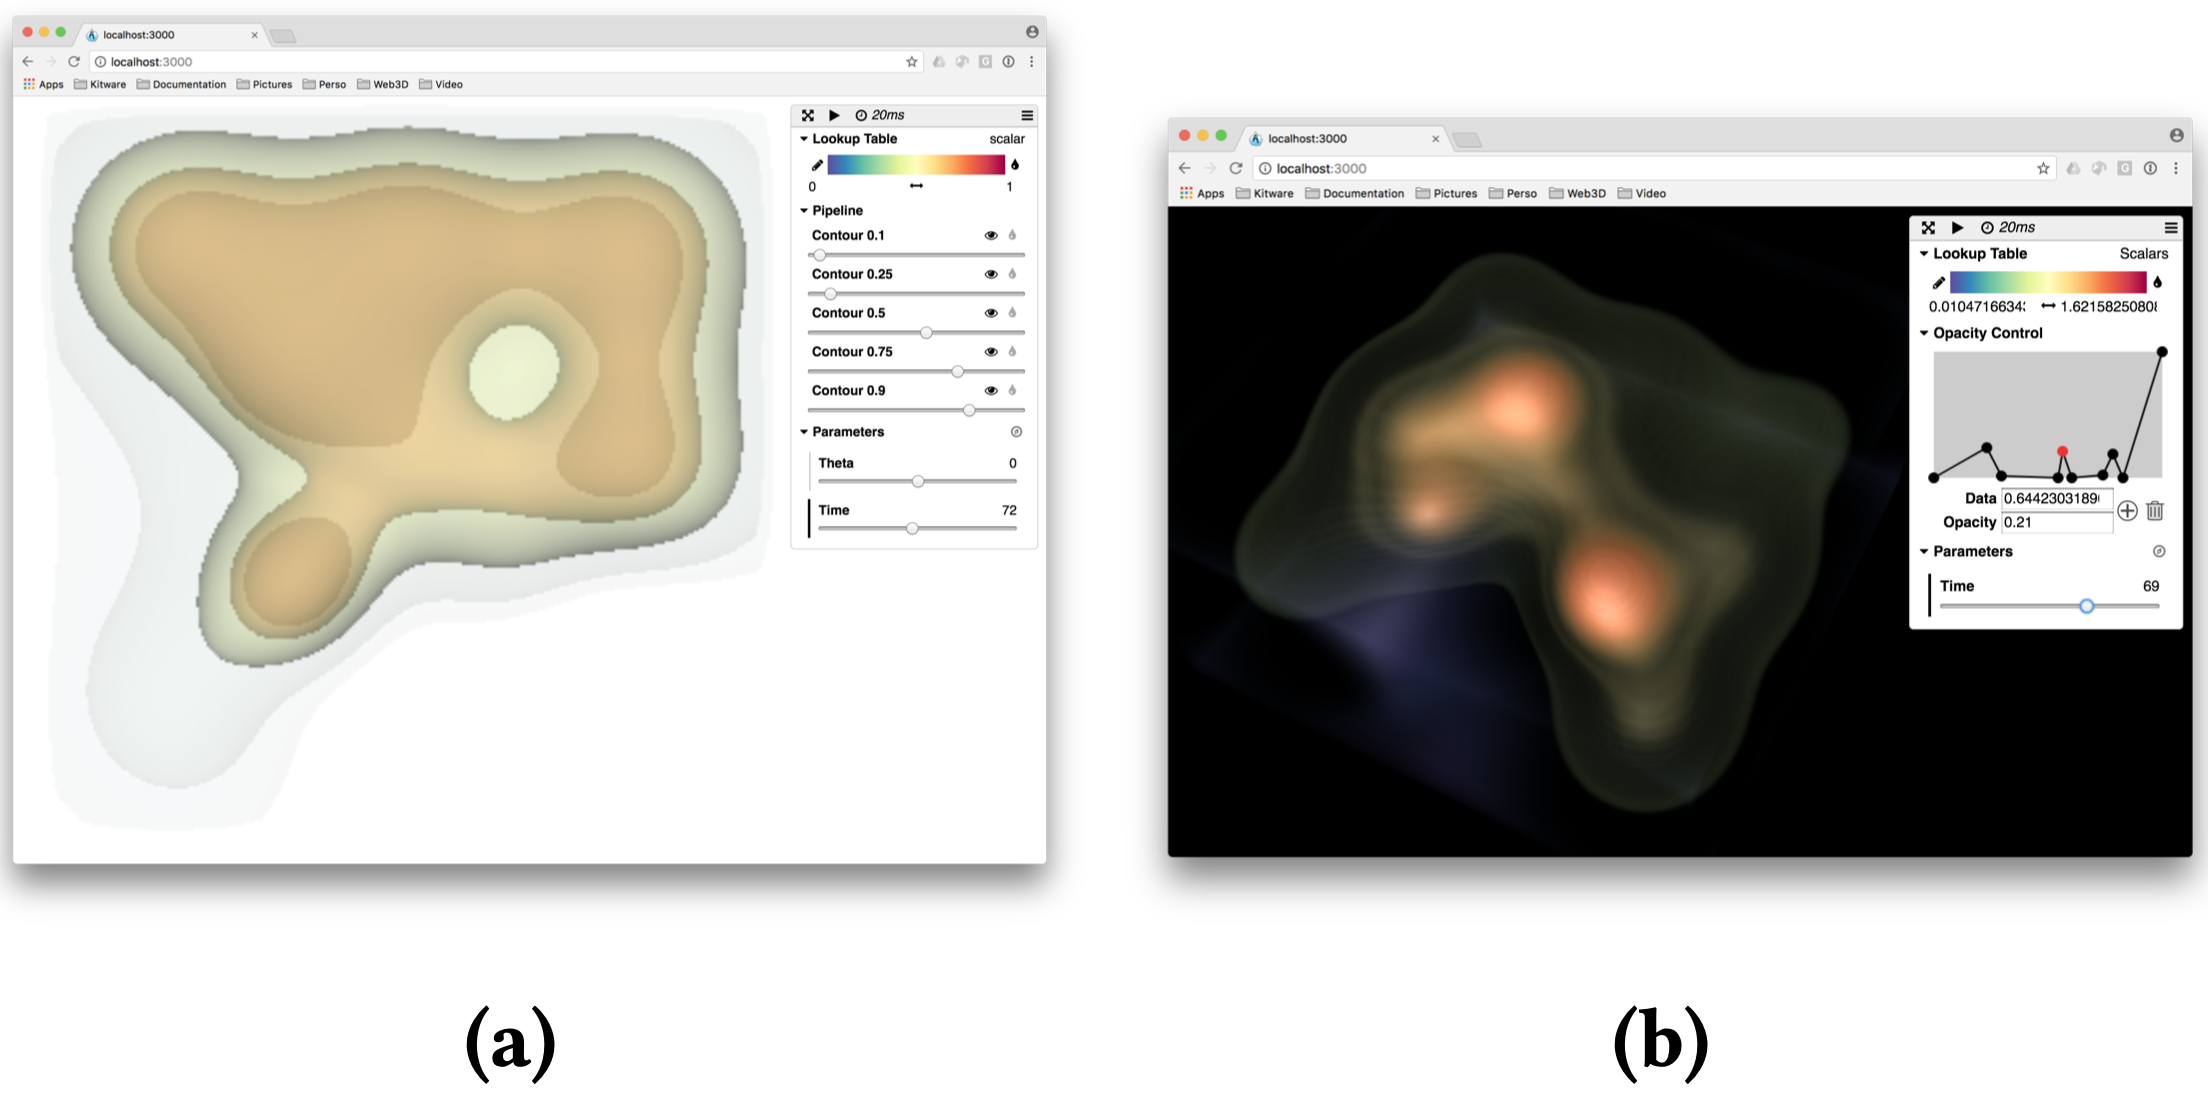
Fig. 10.3 Isocontours - Complex periodic system composed of a grid of nine big oscillators and four interleaved smaller ones with various frequencies. Visualizations via (a) translucent contours and (b) in-browser volume rendering.
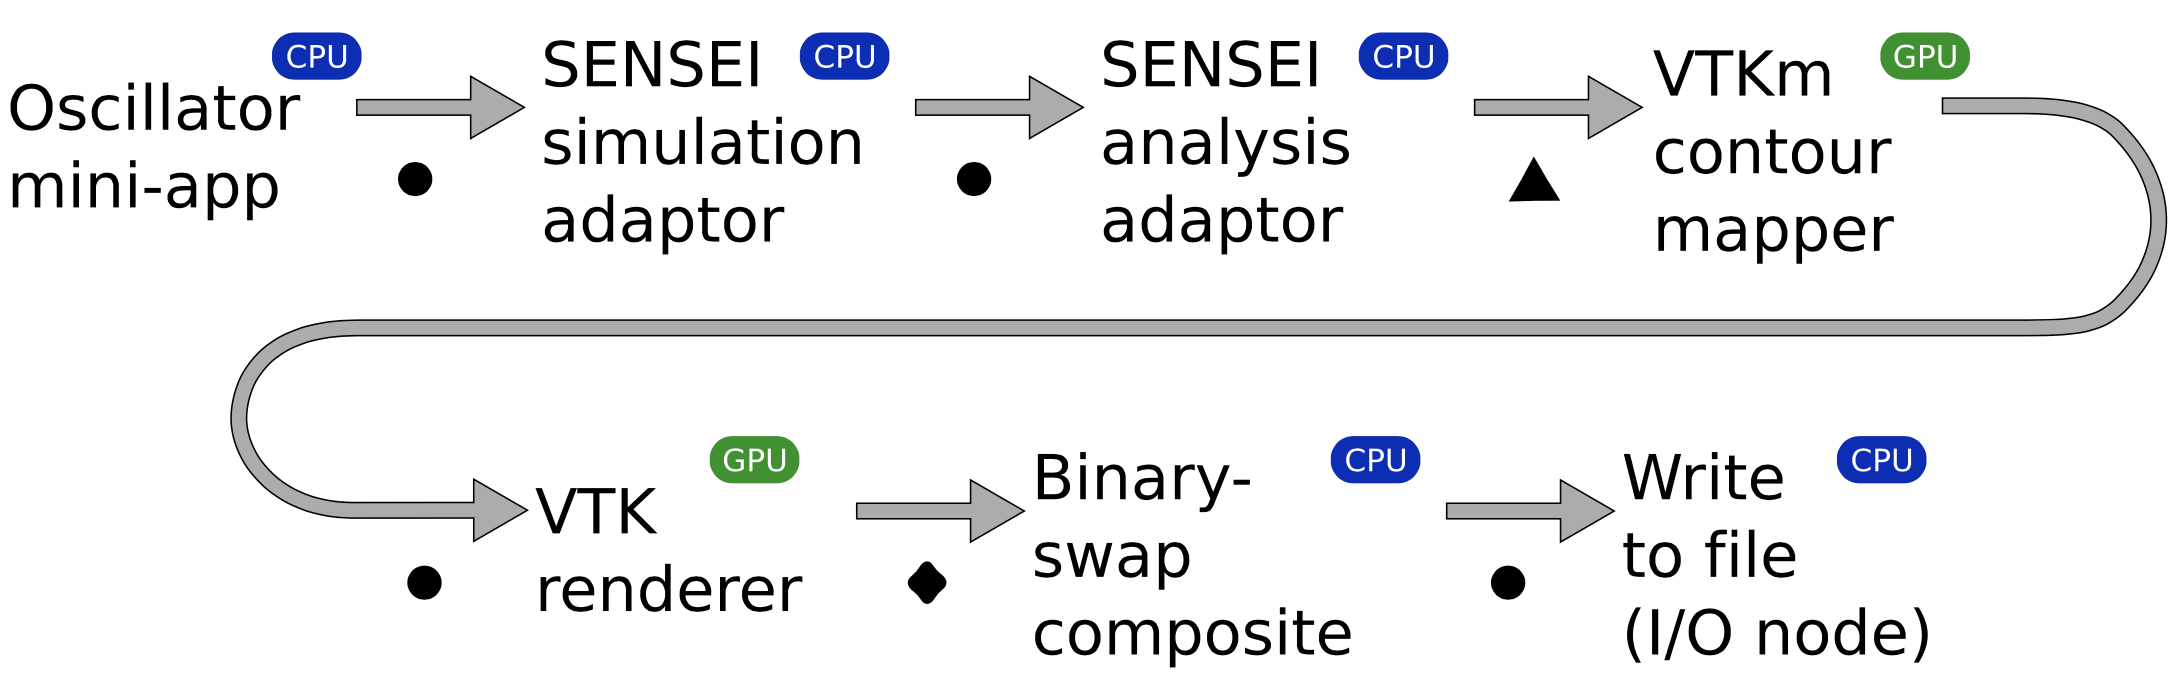
Fig. 10.4 Isocontours - Our visual summary rendering pipeline uses VTKm to compute renderings of isocontours. Circular dots indicate a zero-copy handoff of data. The triangle and dia- mond indicate where VTKm and VTK transfer data to/from the GPU, respectively.